Across systems, not just one solution
Call paths follow your code across the .NET systems it runs in, not only the solution you happen to have open.
Pilot · Five .NET teams
SliceTrace maps symbol usage across all your .NET repositories. Static cross-repo call graphs today; runtime confirmation from OpenTelemetry next.
Become one of five pilot customers — pilot pricing for life.
Visual Studio extension
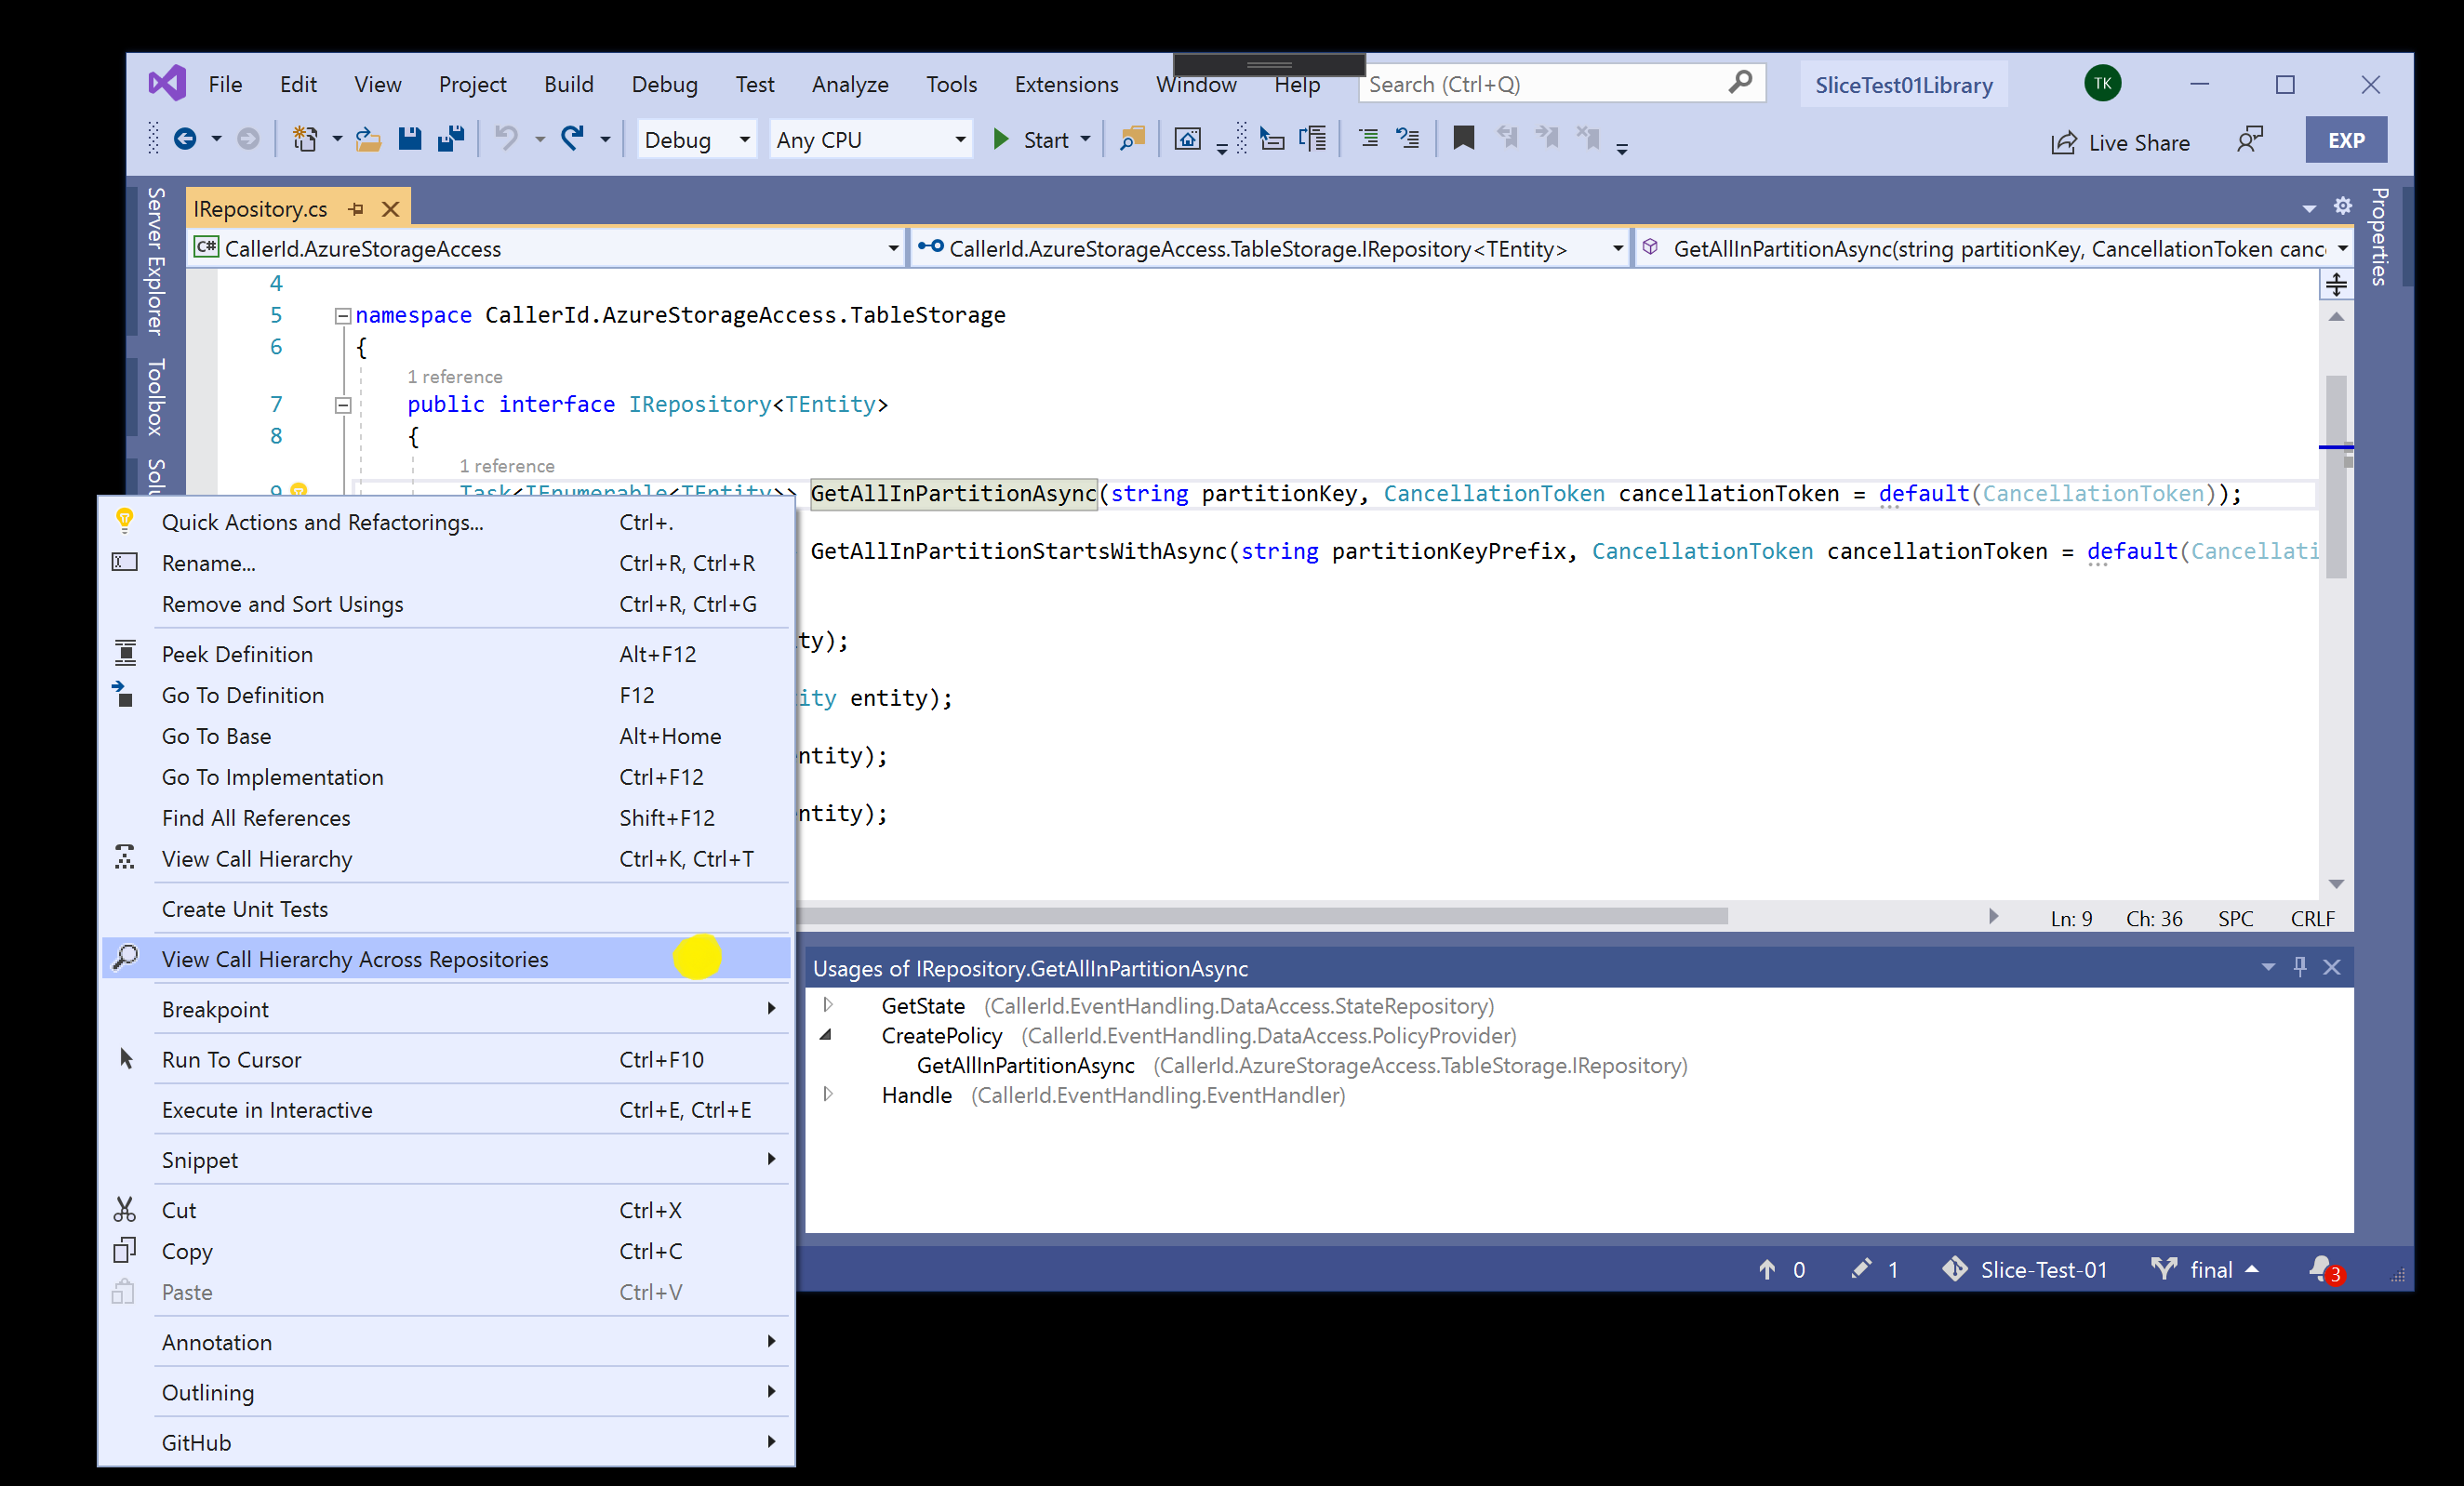
The SliceTrace extension brings the call graph into Visual Studio. Right-click any symbol, choose View Call Hierarchy Across Repositories, and see every caller — including the ones in other repositories — without leaving the editor.
Vote
Upvote every problem you recognise. One vote per problem; click again to undo.
I can’t change this legacy code. I don’t know what breaks.
A change in one repo broke a consumer in another. We found out in production.
Too many PRs. Architecture drifts and nobody notices.
The AI agent can’t find the root cause without a lot of supervision.
Anonymous: we store a random id from your browser (no cookie) with your votes, so each problem counts you once.
How it works
Static analysis shows what your code can call, across repository boundaries. Next, runtime data from OpenTelemetry will confirm what it actually calls.
The SliceTrace scanner runs as a step in your build pipeline and analyses your .NET code statically, so the graph stays current with every build.
Runtime data from OpenTelemetry will add the calls that static analysis alone can’t resolve, including the ones that cross service boundaries.
Pick a class or method and see every call path it is part of. Developers get the answer in Visual Studio, and AI coding agents can query the same paths.
Why SliceTrace
Call paths follow your code across the .NET systems it runs in, not only the solution you happen to have open.
OpenTelemetry data will show which paths your running systems actually take, alongside everything the code could call in theory.
Agents see the same call paths your developers do, so they can reason about the impact of a change instead of guessing from the files in front of them.
Deployment
We run SliceTrace for you. Add the scanner to your pipeline, connect your telemetry, and start tracing call paths.
Run SliceTrace inside your own infrastructure, so your code and telemetry never leave your network.
Pilot
Pilot pricing for life. We work closely with each pilot team on their own .NET estate.
We’ll reply to the work email you gave within a few working days. Want to talk sooner? Contact us.
Contact
Tell me which of these problems you live with, and what SliceTrace would need to do to be worth it for your team.
Book a call (opens in a new tab)